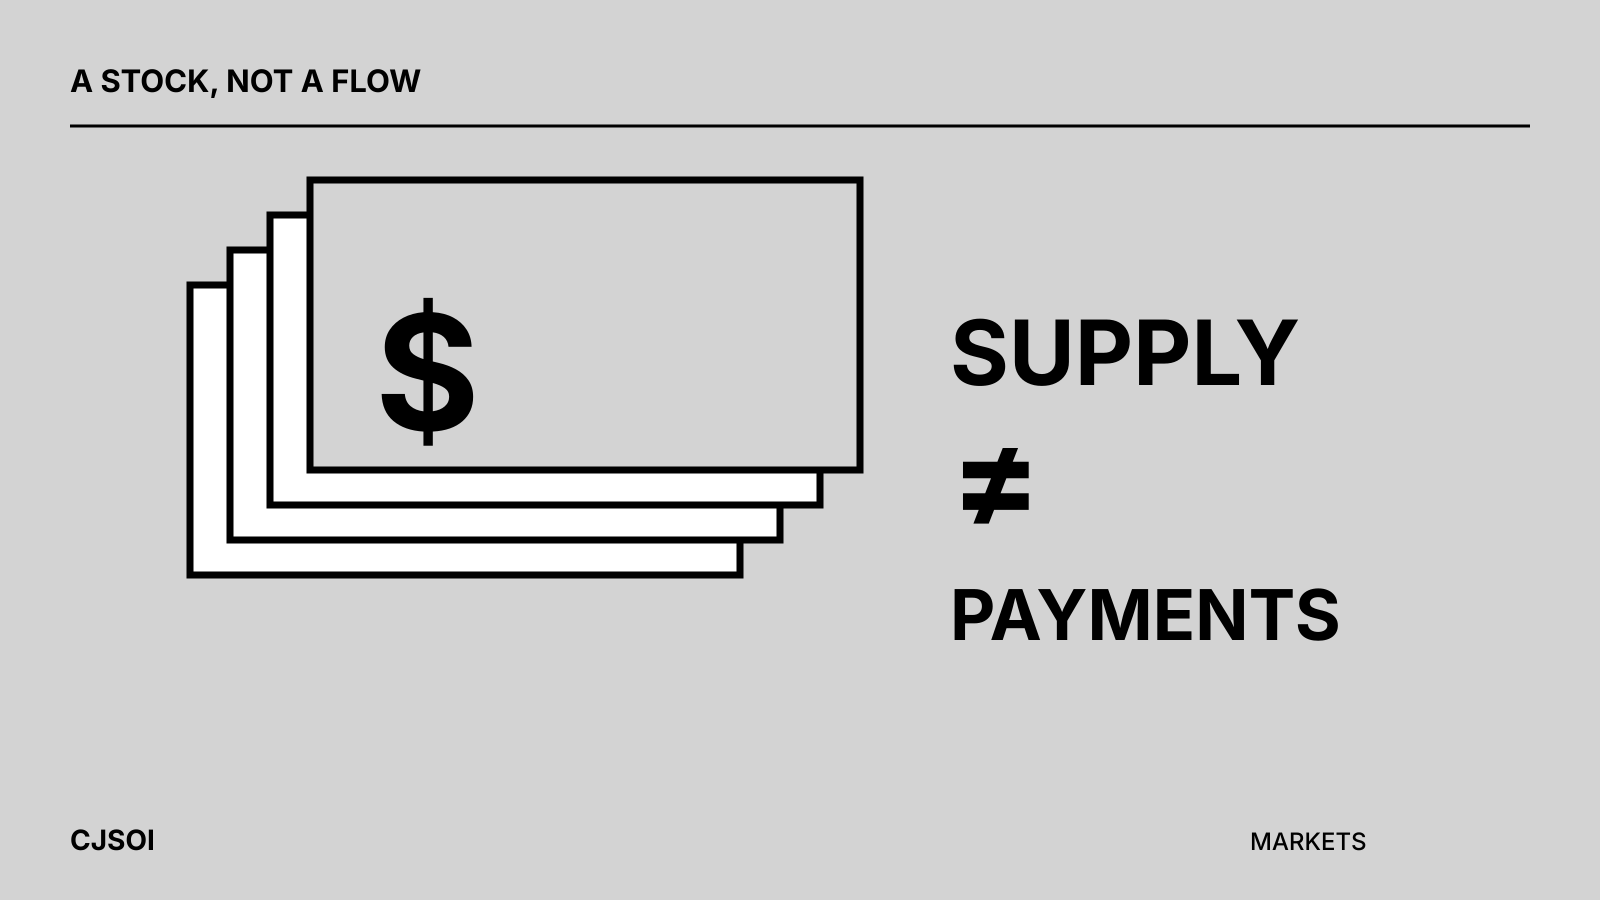
Stablecoin supply measures a stock of tokens outstanding at a point in time. Trading volume and payment volume measure activity over an interval. Confusing the two makes a market story sound more precise than the evidence allows.
A larger supply can create more potential capacity for transfers or trading. It cannot, on its own, tell you whether holders plan to buy crypto, pay suppliers or keep a balance idle.
Outstanding tokens are not all token records
An issuer can distinguish between circulating tokens and inventory authorized but not yet issued. Tether’s transparency page makes that distinction explicitly. Counting every token visible in an issuer-controlled inventory as new money in circulation can overstate the change.
Issuance and redemption are also flows that affect the stock. Circle’s transparency page reports minting and redemption alongside reserve information. The net change is different from the sum of those activities.
In a hypothetical week, an issuer could issue 10 billion tokens and redeem 9 billion, leaving a net increase of 1 billion. Reporting only the issuance figure would omit most of the movement in the opposite direction.
A transfer does not require new issuance
The same token can move many times. A business might receive it, pay a supplier and then see the supplier sell it. That sequence creates several transfers without creating a new token at every step.
Conversely, newly issued tokens may sit in a wallet without moving. A supply chart therefore cannot be read as a direct payment-activity chart.
A useful report names the metric, its unit, its coverage and its interval. “Supply increased” is a narrower statement than “adoption increased,” and a much narrower statement than a prediction about an asset price.
Cross-chain representations complicate totals
A bridged token can represent an asset locked elsewhere. Adding the locked original and the representation as two separate economic claims can double-count the same backing.
Circle’s description of bridged USDC explains this relationship. A sound aggregation method should state whether it measures native issuance, bridged representations, balances by chain or total issuer liabilities.
Movement from one network to another can also change a chain’s local supply without increasing the issuer’s total outstanding tokens. The geographic-looking shape of a chart is not necessarily new demand.
Treat the market interpretation as a hypothesis
An increase may be consistent with greater demand for dollar balances, exchange liquidity or settlement inventory. Supply data alone does not identify which explanation dominates.
To investigate, combine it with evidence relevant to the claim: issuer disclosures, venue balances, defined transfer metrics or documented business activity. Each dataset has its own limits.
Our issuer-economics guide explains another distinction: a period-end supply figure is not the same as an average reserve balance used to earn income.
Questions
Does rising stablecoin supply mean Bitcoin must rise?
No. The metric does not establish how holders will use their balances or what any market price will do.
Can volume rise while supply stays flat?
Yes. Existing tokens can circulate more often without new issuance.
Should bridged and native balances simply be added?
Only with a methodology that avoids counting the same underlying backing twice.
Sources
Tether transparency; Circle transparency; Circle on bridged USDC.